This article is also available on Medium.
This is 3rd in a series of 11 articles on performance marketing concepts and how to calculate them. This is not an exhaustive list of performance marketing concepts, but some of the key ones that can help you understand your marketing efforts and how they are performing. The list of concepts are listed below.
- CPA (Cost Per Acquisition) – Channel efficiency analysis – one of the most important performance marketing metrics, representing the total cost to acquire one customer or conversion action.
- ROAS (Return on Ad Spend) – Campaign profitability measurement – a revenue efficiency metric that measures how much revenue is generated for every dollar spent on advertising.
- LTV (Customer Lifetime Value) – Predictive customer valuation – measures the total net profit a customer generates over their entire relationship with your business. It’s the foundation for determining how much you can afford to spend acquiring customers.
- Cohort Analysis – Customer behavior tracking over time – a method of grouping customers by shared characteristics (typically acquisition date) and tracking their behavior over time to understand patterns in retention, revenue, and lifetime value.
- Contribution Margin – True profitability assessment – the profit remaining after subtracting variable costs from revenue. It represents the amount available to cover fixed costs and generate profit, and critically for performance marketing, it determines how much you can afford to spend on customer acquisition.
- Customer Segmentation – RFM and behavioral clustering – the practice of dividing your customer base into distinct groups that share similar characteristics, behaviors, or value profiles—enabling targeted strategies that improve acquisition efficiency, retention, and lifetime value.
- Churn Prediction – Machine learning models for retention – uses historical customer behavior data to identify which customers are most likely to stop doing business with you, enabling proactive retention interventions before they leave.
- Personalized Offer Scoring – Targeted campaign optimization – predicts which specific offer (discount level, product, message, timing, channel) to present to each individual customer to maximize business outcomes while minimizing unnecessary cost—essentially applying incrementality principles at the individual customer level.
- Attribution Modeling – Multi-touch attribution including Markov chains – assigns credit for conversions across the multiple marketing touchpoints a customer encounters along their journey to purchase. It attempts to answer: “Which marketing activities actually drove this conversion?”
- Cohort-Based LTV – Advanced lifetime value forecasting – measures the actual lifetime value of customers grouped by a shared characteristic (typically acquisition date or channel), tracking their real revenue and behavior over time rather than relying on aggregate or modeled estimates.
- Order Economics – Transaction-level profitability analysis – the complete financial breakdown of an individual transaction—all revenue, costs, and resulting profit from a single order.
Why LTV
In my first article in this series I wrote about CPA – how much it costs to acquire a new customer. Why is that not enough? It’s not uncommon for marketers to look at one conversion at a time and no further. CPA tells us how much that conversion cost us. However, it doesn’t tell us how much that customer is worth.
In the second article, I wrote about ROAS – which incorporates revenue to calculate how profitable our ad spend has been. This is a transaction-level metric that focuses on the immediate performance of our advertising. However, it doesn’t tell us which customers that converted were the most valuable over the long-term.
LTV, on the other hand, focuses on the value of a customer over the life of their relationship with us. It looks at not just the first sale, but all the sales and calculates the value of that relationship. If we were to incorporate LTV into our ROAS calculation, for example, we could compare our ad spend to the long-term value of our customers, instead of just the single sale.
In fact, that is what is often required for businesses that have a subscription-based model. It is not the first sale that makes money, but the recurring revenue stream. Deep discounts on the first sale are not uncommon in this model. That makes LTV an important metric in calculating marketing performance.
Approaches to LTV
There are several approaches to calculating LTV and they all have significance in understanding customer value:
- Historical LTV: Based on past purchases.
- Predictive LTV: Uses statistical models to forecast future value from past purchases.
- Cohort-based LTV: Analyzes customer groups acquired in the same period over a number of equal time periods.
We will walk through calculating each type of LTV using Python. But first, we need some data to work with.
Augmenting Our Sample Dataset
In my first article, I created some tables & sample data in a database to use for the various calculations. It was a very small set of data. To get a better sample, we’re going to add to that dataset by inserting more data into each of the tables. You can copy the SQL code below and run it in your database environment (if you have set up the tables & data from the first article). That will increase the amount of data in the tables and allow for better outcomes for our LTV calculation.
-- ─── CUSTOMERS (11–48) ──────────────────────────────────────────────────────
-- Adds 3+ customers per channel/segment combination and a new referral channel
INSERT INTO customers VALUES
(11, '2023-02-05', 'google_ads',      'high_value',   '2023-02-05'),
(12, '2023-02-18', 'google_ads',      'high_value',   '2023-02-18'),
(13, '2023-03-10', 'google_ads',      'high_value',   '2023-03-10'),
(14, '2023-02-08', 'google_ads',      'medium_value', '2023-02-08'),
(15, '2023-03-22', 'google_ads',      'medium_value', '2023-03-22'),
(16, '2023-04-15', 'google_ads',      'medium_value', '2023-04-15'),
(17, '2023-02-12', 'google_ads',      'low_value',    '2023-02-12'),
(18, '2023-05-03', 'google_ads',      'low_value',    '2023-05-03'),
(19, '2023-02-20', 'facebook_ads',    'high_value',   '2023-02-20'),
(20, '2023-03-14', 'facebook_ads',    'high_value',   '2023-03-14'),
(21, '2023-04-08', 'facebook_ads',    'high_value',   '2023-04-08'),
(22, '2023-02-25', 'facebook_ads',    'medium_value', '2023-02-25'),
(23, '2023-04-19', 'facebook_ads',    'medium_value', '2023-04-19'),
(24, '2023-06-02', 'facebook_ads',    'medium_value', '2023-06-02'),
(25, '2023-03-05', 'facebook_ads',    'low_value',    '2023-03-05'),
(26, '2023-05-17', 'facebook_ads',    'low_value',    '2023-05-17'),
(27, '2023-02-10', 'organic_search',  'high_value',   '2023-02-10'),
(28, '2023-04-22', 'organic_search',  'high_value',   '2023-04-22'),
(29, '2023-06-11', 'organic_search',  'high_value',   '2023-06-11'),
(30, '2023-03-18', 'organic_search',  'medium_value', '2023-03-18'),
(31, '2023-05-09', 'organic_search',  'medium_value', '2023-05-09'),
(32, '2023-07-14', 'organic_search',  'medium_value', '2023-07-14'),
(33, '2023-02-28', 'organic_search',  'low_value',    '2023-02-28'),
(34, '2023-06-20', 'organic_search',  'low_value',    '2023-06-20'),
(35, '2023-03-12', 'email_marketing', 'high_value',   '2023-03-12'),
(36, '2023-06-28', 'email_marketing', 'high_value',   '2023-06-28'),
(37, '2023-04-05', 'email_marketing', 'medium_value', '2023-04-05'),
(38, '2023-07-22', 'email_marketing', 'medium_value', '2023-07-22'),
(39, '2023-03-30', 'email_marketing', 'low_value',    '2023-03-30'),
(40, '2023-08-14', 'email_marketing', 'low_value',    '2023-08-14'),
(41, '2023-04-17', 'referral',        'high_value',   '2023-04-17'),
(42, '2023-05-28', 'referral',        'high_value',   '2023-05-28'),
(43, '2023-07-09', 'referral',        'high_value',   '2023-07-09'),
(44, '2023-04-25', 'referral',        'medium_value', '2023-04-25'),
(45, '2023-06-15', 'referral',        'medium_value', '2023-06-15'),
(46, '2023-08-03', 'referral',        'medium_value', '2023-08-03'),
(47, '2023-05-20', 'referral',        'low_value',    '2023-05-20'),
(48, '2023-09-11', 'referral',        'low_value',    '2023-09-11');

-- ─── ORDERS (11–135) ────────────────────────────────────────────────────────
-- Multiple repeat purchases per customer; order values reflect segment tier
-- high_value: $280–$530 | medium_value: $110–$190 | low_value: $45–$78
INSERT INTO orders VALUES
-- Customer 11 (google_ads, high_value)
(11,  11, '2023-02-05', 350.00, 175.00, 15.00),
(12,  11, '2023-04-10', 420.00, 210.00, 15.00),
(13,  11, '2023-06-22', 280.00, 140.00, 12.00),
(14,  11, '2023-09-15', 510.00, 255.00, 20.00),
(15,  11, '2023-12-01', 380.00, 190.00, 15.00),
-- Customer 12 (google_ads, high_value)
(16,  12, '2023-02-18', 290.00, 145.00, 12.00),
(17,  12, '2023-05-03', 450.00, 225.00, 18.00),
(18,  12, '2023-08-19', 320.00, 160.00, 14.00),
(19,  12, '2024-01-07', 480.00, 240.00, 20.00),
-- Customer 13 (google_ads, high_value)
(20,  13, '2023-03-10', 410.00, 205.00, 16.00),
(21,  13, '2023-05-25', 350.00, 175.00, 14.00),
(22,  13, '2023-08-08', 290.00, 145.00, 12.00),
(23,  13, '2023-11-14', 520.00, 260.00, 20.00),
(24,  13, '2024-02-20', 370.00, 185.00, 15.00),
-- Customer 14 (google_ads, medium_value)
(25,  14, '2023-02-08', 130.00,  65.00, 10.00),
(26,  14, '2023-04-15', 160.00,  80.00, 10.00),
(27,  14, '2023-07-28', 110.00,  55.00,  9.00),
-- Customer 15 (google_ads, medium_value)
(28,  15, '2023-03-22', 145.00,  72.50, 10.00),
(29,  15, '2023-06-14', 180.00,  90.00, 12.00),
(30,  15, '2023-10-05', 125.00,  62.50,  9.00),
-- Customer 16 (google_ads, medium_value)
(31,  16, '2023-04-15', 155.00,  77.50, 10.00),
(32,  16, '2023-07-22', 190.00,  95.00, 12.00),
-- Customer 17 (google_ads, low_value)
(33,  17, '2023-02-12',  55.00,  27.50,  6.00),
(34,  17, '2023-05-18',  65.00,  32.50,  7.00),
-- Customer 18 (google_ads, low_value)
(35,  18, '2023-05-03',  48.00,  24.00,  6.00),
(36,  18, '2023-08-11',  72.00,  36.00,  7.00),
(37,  18, '2023-11-25',  58.00,  29.00,  6.00),
-- Customer 19 (facebook_ads, high_value)
(38,  19, '2023-02-20', 380.00, 190.00, 16.00),
(39,  19, '2023-04-30', 450.00, 225.00, 18.00),
(40,  19, '2023-07-15', 290.00, 145.00, 12.00),
(41,  19, '2023-10-22', 520.00, 260.00, 20.00),
-- Customer 20 (facebook_ads, high_value)
(42,  20, '2023-03-14', 310.00, 155.00, 14.00),
(43,  20, '2023-06-08', 480.00, 240.00, 19.00),
(44,  20, '2023-09-20', 360.00, 180.00, 15.00),
(45,  20, '2024-01-15', 420.00, 210.00, 17.00),
(46,  20, '2024-03-10', 280.00, 140.00, 12.00),
-- Customer 21 (facebook_ads, high_value)
(47,  21, '2023-04-08', 420.00, 210.00, 17.00),
(48,  21, '2023-06-25', 350.00, 175.00, 14.00),
(49,  21, '2023-09-12', 490.00, 245.00, 19.00),
(50,  21, '2023-12-20', 310.00, 155.00, 13.00),
-- Customer 22 (facebook_ads, medium_value)
(51,  22, '2023-02-25', 140.00,  70.00, 10.00),
(52,  22, '2023-05-10', 175.00,  87.50, 11.00),
(53,  22, '2023-08-28', 120.00,  60.00,  9.00),
(54,  22, '2023-12-05', 160.00,  80.00, 10.00),
-- Customer 23 (facebook_ads, medium_value)
(55,  23, '2023-04-19', 165.00,  82.50, 11.00),
(56,  23, '2023-07-03', 145.00,  72.50, 10.00),
(57,  23, '2023-10-18', 185.00,  92.50, 12.00),
-- Customer 24 (facebook_ads, medium_value)
(58,  24, '2023-06-02', 130.00,  65.00, 10.00),
(59,  24, '2023-09-14', 155.00,  77.50, 10.00),
-- Customer 25 (facebook_ads, low_value)
(60,  25, '2023-03-05',  62.00,  31.00,  7.00),
(61,  25, '2023-06-18',  45.00,  22.50,  6.00),
-- Customer 26 (facebook_ads, low_value)
(62,  26, '2023-05-17',  70.00,  35.00,  7.00),
(63,  26, '2023-09-02',  55.00,  27.50,  6.00),
(64,  26, '2023-12-14',  65.00,  32.50,  7.00),
-- Customer 27 (organic_search, high_value)
(65,  27, '2023-02-10', 330.00, 165.00, 14.00),
(66,  27, '2023-04-28', 410.00, 205.00, 16.00),
(67,  27, '2023-07-19', 360.00, 180.00, 15.00),
(68,  27, '2023-10-08', 480.00, 240.00, 19.00),
(69,  27, '2024-01-22', 390.00, 195.00, 16.00),
-- Customer 28 (organic_search, high_value)
(70,  28, '2023-04-22', 290.00, 145.00, 12.00),
(71,  28, '2023-07-10', 440.00, 220.00, 18.00),
(72,  28, '2023-10-25', 380.00, 190.00, 15.00),
(73,  28, '2024-02-08', 510.00, 255.00, 20.00),
-- Customer 29 (organic_search, high_value)
(74,  29, '2023-06-11', 350.00, 175.00, 14.00),
(75,  29, '2023-08-30', 420.00, 210.00, 17.00),
(76,  29, '2023-11-18', 290.00, 145.00, 12.00),
(77,  29, '2024-03-05', 460.00, 230.00, 18.00),
-- Customer 30 (organic_search, medium_value)
(78,  30, '2023-03-18', 150.00,  75.00, 10.00),
(79,  30, '2023-06-05', 170.00,  85.00, 11.00),
(80,  30, '2023-09-22', 135.00,  67.50, 10.00),
-- Customer 31 (organic_search, medium_value)
(81,  31, '2023-05-09', 160.00,  80.00, 11.00),
(82,  31, '2023-08-17', 145.00,  72.50, 10.00),
(83,  31, '2023-11-30', 190.00,  95.00, 12.00),
-- Customer 32 (organic_search, medium_value)
(84,  32, '2023-07-14', 175.00,  87.50, 11.00),
(85,  32, '2023-10-28', 155.00,  77.50, 10.00),
-- Customer 33 (organic_search, low_value)
(86,  33, '2023-02-28',  50.00,  25.00,  6.00),
(87,  33, '2023-06-10',  68.00,  34.00,  7.00),
-- Customer 34 (organic_search, low_value)
(88,  34, '2023-06-20',  58.00,  29.00,  6.00),
(89,  34, '2023-10-14',  75.00,  37.50,  7.00),
(90,  34, '2024-01-30',  62.00,  31.00,  7.00),
-- Customer 35 (email_marketing, high_value)
(91,  35, '2023-03-12', 390.00, 195.00, 16.00),
(92,  35, '2023-05-28', 460.00, 230.00, 18.00),
(93,  35, '2023-08-15', 320.00, 160.00, 14.00),
(94,  35, '2023-11-02', 500.00, 250.00, 20.00),
(95,  35, '2024-02-14', 410.00, 205.00, 16.00),
-- Customer 36 (email_marketing, high_value)
(96,  36, '2023-06-28', 340.00, 170.00, 14.00),
(97,  36, '2023-09-10', 430.00, 215.00, 17.00),
(98,  36, '2023-12-22', 370.00, 185.00, 15.00),
(99,  36, '2024-03-18', 490.00, 245.00, 19.00),
-- Customer 37 (email_marketing, medium_value)
(100, 37, '2023-04-05', 145.00,  72.50, 10.00),
(101, 37, '2023-07-20', 170.00,  85.00, 11.00),
(102, 37, '2023-11-08', 130.00,  65.00, 10.00),
-- Customer 38 (email_marketing, medium_value)
(103, 38, '2023-07-22', 165.00,  82.50, 11.00),
(104, 38, '2023-10-15', 185.00,  92.50, 12.00),
-- Customer 39 (email_marketing, low_value)
(105, 39, '2023-03-30',  52.00,  26.00,  6.00),
(106, 39, '2023-07-12',  68.00,  34.00,  7.00),
(107, 39, '2023-11-05',  45.00,  22.50,  6.00),
-- Customer 40 (email_marketing, low_value)
(108, 40, '2023-08-14',  60.00,  30.00,  7.00),
(109, 40, '2023-12-01',  72.00,  36.00,  7.00),
-- Customer 41 (referral, high_value)
(110, 41, '2023-04-17', 450.00, 225.00, 18.00),
(111, 41, '2023-06-30', 380.00, 190.00, 15.00),
(112, 41, '2023-09-18', 520.00, 260.00, 20.00),
(113, 41, '2023-12-08', 410.00, 205.00, 16.00),
(114, 41, '2024-03-22', 480.00, 240.00, 19.00),
-- Customer 42 (referral, high_value)
(115, 42, '2023-05-28', 360.00, 180.00, 15.00),
(116, 42, '2023-08-14', 490.00, 245.00, 19.00),
(117, 42, '2023-11-27', 420.00, 210.00, 17.00),
(118, 42, '2024-02-19', 350.00, 175.00, 14.00),
-- Customer 43 (referral, high_value)
(119, 43, '2023-07-09', 410.00, 205.00, 16.00),
(120, 43, '2023-09-25', 480.00, 240.00, 19.00),
(121, 43, '2023-12-14', 350.00, 175.00, 14.00),
(122, 43, '2024-03-28', 530.00, 265.00, 21.00),
-- Customer 44 (referral, medium_value)
(123, 44, '2023-04-25', 155.00,  77.50, 10.00),
(124, 44, '2023-07-18', 175.00,  87.50, 11.00),
(125, 44, '2023-10-30', 145.00,  72.50, 10.00),
-- Customer 45 (referral, medium_value)
(126, 45, '2023-06-15', 170.00,  85.00, 11.00),
(127, 45, '2023-09-28', 160.00,  80.00, 11.00),
(128, 45, '2024-01-10', 190.00,  95.00, 12.00),
-- Customer 46 (referral, medium_value)
(129, 46, '2023-08-03', 140.00,  70.00, 10.00),
(130, 46, '2023-11-19', 175.00,  87.50, 11.00),
-- Customer 47 (referral, low_value)
(131, 47, '2023-05-20',  65.00,  32.50,  7.00),
(132, 47, '2023-09-07',  78.00,  39.00,  8.00),
(133, 47, '2023-12-28',  55.00,  27.50,  6.00),
-- Customer 48 (referral, low_value)
(134, 48, '2023-09-11',  70.00,  35.00,  7.00),
(135, 48, '2024-01-25',  58.00,  29.00,  6.00);

-- ─── MARKETING SPEND (Feb 2023 – Mar 2024) ──────────────────────────────────
-- Monthly entries for all 5 channels to support spend-vs-LTV analysis
INSERT INTO marketing_spend VALUES
('2023-02-01', 'google_ads',       520.00, 10500, 210),
('2023-02-01', 'facebook_ads',     320.00,  8500, 160),
('2023-02-01', 'organic_search',     0.00,  5500, 270),
('2023-02-01', 'email_marketing',  110.00,  2200, 105),
('2023-02-01', 'referral',          50.00,  1500,  80),
('2023-03-01', 'google_ads',       580.00, 11200, 225),
('2023-03-01', 'facebook_ads',     380.00,  9200, 175),
('2023-03-01', 'organic_search',     0.00,  6000, 290),
('2023-03-01', 'email_marketing',  125.00,  2500, 120),
('2023-03-01', 'referral',          60.00,  1800,  90),
('2023-04-01', 'google_ads',       620.00, 12000, 240),
('2023-04-01', 'facebook_ads',     420.00,  9800, 190),
('2023-04-01', 'organic_search',     0.00,  6500, 310),
('2023-04-01', 'email_marketing',  130.00,  2600, 125),
('2023-04-01', 'referral',          65.00,  2000,  95),
('2023-05-01', 'google_ads',       650.00, 12500, 250),
('2023-05-01', 'facebook_ads',     440.00, 10200, 200),
('2023-05-01', 'organic_search',     0.00,  7000, 330),
('2023-05-01', 'email_marketing',  140.00,  2800, 130),
('2023-05-01', 'referral',          70.00,  2200, 100),
('2023-06-01', 'google_ads',       600.00, 11800, 236),
('2023-06-01', 'facebook_ads',     410.00,  9500, 185),
('2023-06-01', 'organic_search',     0.00,  6800, 320),
('2023-06-01', 'email_marketing',  135.00,  2700, 128),
('2023-06-01', 'referral',          68.00,  2100,  98),
('2023-07-01', 'google_ads',       580.00, 11500, 230),
('2023-07-01', 'facebook_ads',     390.00,  9000, 178),
('2023-07-01', 'organic_search',     0.00,  6400, 305),
('2023-07-01', 'email_marketing',  120.00,  2400, 115),
('2023-07-01', 'referral',          62.00,  1900,  88),
('2023-08-01', 'google_ads',       560.00, 11000, 220),
('2023-08-01', 'facebook_ads',     370.00,  8800, 170),
('2023-08-01', 'organic_search',     0.00,  6200, 295),
('2023-08-01', 'email_marketing',  115.00,  2300, 110),
('2023-08-01', 'referral',          58.00,  1800,  85),
('2023-09-01', 'google_ads',       610.00, 12000, 245),
('2023-09-01', 'facebook_ads',     430.00,  9600, 192),
('2023-09-01', 'organic_search',     0.00,  6800, 318),
('2023-09-01', 'email_marketing',  145.00,  2900, 138),
('2023-09-01', 'referral',          72.00,  2200, 102),
('2023-10-01', 'google_ads',       680.00, 13000, 265),
('2023-10-01', 'facebook_ads',     480.00, 10800, 215),
('2023-10-01', 'organic_search',     0.00,  7200, 340),
('2023-10-01', 'email_marketing',  155.00,  3100, 148),
('2023-10-01', 'referral',          78.00,  2400, 108),
('2023-11-01', 'google_ads',       750.00, 14500, 295),
('2023-11-01', 'facebook_ads',     550.00, 12000, 240),
('2023-11-01', 'organic_search',     0.00,  8000, 375),
('2023-11-01', 'email_marketing',  175.00,  3500, 165),
('2023-11-01', 'referral',          85.00,  2600, 118),
('2023-12-01', 'google_ads',       820.00, 16000, 325),
('2023-12-01', 'facebook_ads',     620.00, 13500, 270),
('2023-12-01', 'organic_search',     0.00,  8800, 410),
('2023-12-01', 'email_marketing',  195.00,  3900, 185),
('2023-12-01', 'referral',          92.00,  2800, 128),
('2024-01-01', 'google_ads',       590.00, 11500, 232),
('2024-01-01', 'facebook_ads',     400.00,  9200, 182),
('2024-01-01', 'organic_search',     0.00,  6600, 312),
('2024-01-01', 'email_marketing',  128.00,  2550, 122),
('2024-01-01', 'referral',          64.00,  1950,  90),
('2024-02-01', 'google_ads',       615.00, 12000, 242),
('2024-02-01', 'facebook_ads',     425.00,  9600, 188),
('2024-02-01', 'organic_search',     0.00,  6900, 325),
('2024-02-01', 'email_marketing',  132.00,  2650, 126),
('2024-02-01', 'referral',          66.00,  2000,  92),
('2024-03-01', 'google_ads',       640.00, 12400, 250),
('2024-03-01', 'facebook_ads',     445.00,  9900, 195),
('2024-03-01', 'organic_search',     0.00,  7100, 335),
('2024-03-01', 'email_marketing',  138.00,  2750, 130),
('2024-03-01', 'referral',          70.00,  2100,  96);

-- ─── ATTRIBUTION TOUCHPOINTS (6–58) ─────────────────────────────────────────
-- Multi-touch journeys for high/medium value customers; single-touch for low
INSERT INTO attribution_touchpoints VALUES
(6,  11, 'google_ads',      '2023-02-04', 350.00, 1),
(7,  11, 'email_marketing', '2023-02-05', 350.00, 2),
(8,  12, 'google_ads',      '2023-02-17', 290.00, 1),
(9,  12, 'organic_search',  '2023-02-18', 290.00, 2),
(10, 13, 'organic_search',  '2023-03-08', 410.00, 1),
(11, 13, 'google_ads',      '2023-03-09', 410.00, 2),
(12, 13, 'email_marketing', '2023-03-10', 410.00, 3),
(13, 14, 'google_ads',      '2023-02-07', 130.00, 1),
(14, 14, 'facebook_ads',    '2023-02-08', 130.00, 2),
(15, 19, 'facebook_ads',    '2023-02-18', 380.00, 1),
(16, 19, 'google_ads',      '2023-02-19', 380.00, 2),
(17, 19, 'facebook_ads',    '2023-02-20', 380.00, 3),
(18, 20, 'facebook_ads',    '2023-03-12', 310.00, 1),
(19, 20, 'email_marketing', '2023-03-13', 310.00, 2),
(20, 20, 'facebook_ads',    '2023-03-14', 310.00, 3),
(21, 21, 'google_ads',      '2023-04-06', 420.00, 1),
(22, 21, 'facebook_ads',    '2023-04-07', 420.00, 2),
(23, 21, 'facebook_ads',    '2023-04-08', 420.00, 3),
(24, 27, 'organic_search',  '2023-02-09', 330.00, 1),
(25, 27, 'email_marketing', '2023-02-10', 330.00, 2),
(26, 28, 'organic_search',  '2023-04-20', 290.00, 1),
(27, 28, 'google_ads',      '2023-04-21', 290.00, 2),
(28, 28, 'organic_search',  '2023-04-22', 290.00, 3),
(29, 29, 'organic_search',  '2023-06-10', 350.00, 1),
(30, 29, 'facebook_ads',    '2023-06-11', 350.00, 2),
(31, 35, 'email_marketing', '2023-03-10', 390.00, 1),
(32, 35, 'google_ads',      '2023-03-11', 390.00, 2),
(33, 35, 'email_marketing', '2023-03-12', 390.00, 3),
(34, 36, 'email_marketing', '2023-06-26', 340.00, 1),
(35, 36, 'organic_search',  '2023-06-27', 340.00, 2),
(36, 36, 'email_marketing', '2023-06-28', 340.00, 3),
(37, 41, 'referral',        '2023-04-15', 450.00, 1),
(38, 41, 'google_ads',      '2023-04-16', 450.00, 2),
(39, 41, 'referral',        '2023-04-17', 450.00, 3),
(40, 42, 'referral',        '2023-05-26', 360.00, 1),
(41, 42, 'facebook_ads',    '2023-05-27', 360.00, 2),
(42, 42, 'referral',        '2023-05-28', 360.00, 3),
(43, 43, 'referral',        '2023-07-07', 410.00, 1),
(44, 43, 'organic_search',  '2023-07-08', 410.00, 2),
(45, 43, 'referral',        '2023-07-09', 410.00, 3),
(46, 22, 'facebook_ads',    '2023-02-24', 140.00, 1),
(47, 22, 'email_marketing', '2023-02-25', 140.00, 2),
(48, 30, 'organic_search',  '2023-03-17', 150.00, 1),
(49, 30, 'email_marketing', '2023-03-18', 150.00, 2),
(50, 37, 'email_marketing', '2023-04-04', 145.00, 1),
(51, 37, 'google_ads',      '2023-04-05', 145.00, 2),
(52, 44, 'referral',        '2023-04-24', 155.00, 1),
(53, 44, 'facebook_ads',    '2023-04-25', 155.00, 2),
(54, 17, 'google_ads',      '2023-02-12',  55.00, 1),
(55, 25, 'facebook_ads',    '2023-03-05',  62.00, 1),
(56, 33, 'organic_search',  '2023-02-28',  50.00, 1),
(57, 39, 'email_marketing', '2023-03-30',  52.00, 1),
(58, 47, 'referral',        '2023-05-20',  65.00, 1);Code language: JavaScript (javascript)
Importing Packages & Retrieving Data
Our first step is to load the Python packages/modules we will need. Then we will need to retrieve the data from the database and create some dataframes to hold the data. I will comment the code so you can understand what it is doing at each step.
import pandas as pd # For data tables.
import numpy as np # For data arrays and typed data.
import matplotlib.pyplot as plt # To plot data.
import matplotlib.ticker as mticker # tick mark location & label.
import seaborn as sns # For stats visualisation.
from datetime import datetime, timedelta # For datetime data.
from sqlalchemy import create_engine, text # To connect to PostgreSQL db.
from sklearn.model_selection import train_test_split # To split dataframes into random test/train subsets.
from sklearn.ensemble import RandomForestRegressor # Ensemble learning method that builds decision trees for regression.
from sklearn.metrics import mean_squared_error, r2_score # Fundamental regression evaluation metrics.
from sklearn.preprocessing import LabelEncoder # Converts categorical labels into integer codes.
from operator import attrgetter # Creates a callable for retrieving attributes from a list.Code language: Python (python)
Now that we have loaded all the packages/modules we will be using, we are going to retrieve the data we will need to calculate the various LTVs.
# Create connection to database.
# In this case, you'll need username, password, port, host and db.
engine = create_engine(
    "postgresql+psycopg2://postgres:Data123@localhost:5432/postgres",
    connect_args={"options": "-csearch_path=marketing_guide"}
)

# Test connection to the database.
with engine.connect() as conn:
    conn.execute(text("SELECT 1"))

# Load data - assign to dataframes.
with engine.connect() as conn:
    customers = pd.read_sql_query("SELECT * FROM customers", conn)
    marketing_spend = pd.read_sql_query("SELECT * FROM marketing_spend", conn)
    orders = pd.read_sql_query("SELECT * FROM orders", conn)
    attribution_touchpoints = pd.read_sql_query("SELECT * FROM attribution_touchpoints", conn)

# Disconnect from database.
engine.dispose()Code language: PHP (php)
Calculating Historical LTV
Historical LTV is a descriptive analytics calculation based on past sales from customers. We are simply adding the sales for each customer and averaging the total value. First, we will create a function to calculate the historical LTV.
# Historical LTV calculation
def calculate_historical_ltv(customers_df, orders_df):
    customer_orders = customers_df.merge(orders_df, on='customer_id')

    # Convert dates
    customer_orders['order_date'] = pd.to_datetime(customer_orders['order_date'])
    customer_orders['first_purchase_date'] = pd.to_datetime(customer_orders['first_purchase_date'])

    ltv_data = customer_orders.groupby(['customer_id', 'acquisition_channel', 'customer_segment']).agg({
        'order_value': ['count', 'sum', 'mean'],
        'order_date': ['min', 'max'],
        'first_purchase_date': 'first'
    }).reset_index()

    # Flatten column names
    ltv_data.columns = ['customer_id', 'acquisition_channel', 'customer_segment',
                       'total_orders', 'total_revenue', 'avg_order_value',
                       'first_order_date', 'last_order_date', 'first_purchase_date']

    # Calculate customer lifespan
    ltv_data['customer_lifespan_days'] = (ltv_data['last_order_date'] - ltv_data['first_purchase_date']).dt.days + 1
    ltv_data['purchase_frequency'] = ltv_data['total_orders'] / (ltv_data['customer_lifespan_days'] / 365.25)
    ltv_data['historical_ltv'] = ltv_data['total_revenue']

    return ltv_dataCode language: PHP (php)
Next, we can call the function and pass the dataframe to the function. We can then print details about the data.
historical_ltv = calculate_historical_ltv(customers, orders)
print("Historical LTV Analysis:")
print(historical_ltv.describe())Code language: Python (python)
This will print out a lot of details on the data. Admittedly, much of this is not very useful. However, the key data points are the number of customers, the number of orders, the total revenue, the average order value, and most importantly (for our purposes) the historical LTV. Beyond that, it is also very helpful to know the purchase frequency and the customer lifespan. Here is a sample of the output:

We can also calculate the historical LTV by acquisition channel and customer segment:
# LTV summary by segment
ltv_summary = historical_ltv.groupby(['acquisition_channel', 'customer_segment']).agg({
    'historical_ltv': ['mean', 'median', 'std', 'count']
}).round(2)

print("\nLTV Summary by Channel and Segment:")
print(ltv_summary)Code language: PHP (php)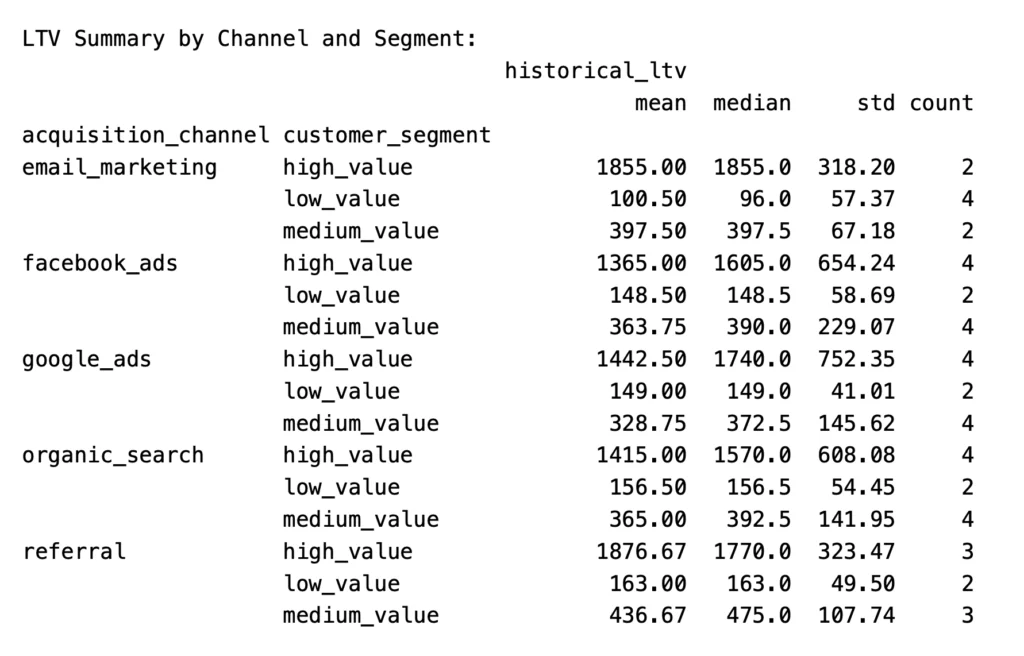
We can graph the output to show LTV by acquisition channel, which can give you some idea about which channels are most valuable. We’ll create a bar chart in Python.
# Create a figure and axes object (10 wide x 6 tall)
fig, ax = plt.subplots(figsize=(10, 6))

# We'll group by acquisition channel and compute mean LTV per channel.
# We'll also sort descending so the highest-value channel appears first.
channel_ltv = (historical_ltv
               .groupby('acquisition_channel')['historical_ltv']
               .mean()
               .sort_values(ascending=False))

# Draw the bar chart — len(channel_ltv) ensures one shade per channel.
bars = ax.bar(channel_ltv.index, channel_ltv.values,
              color=sns.color_palette("Blues_d", len(channel_ltv)))

# Set chart title and axis labels.
ax.set_title('Average LTV by Acquisition Channel', fontweight='bold')
ax.set_xlabel('Acquisition Channel')
ax.set_ylabel('Average LTV ($)')

# Format the y-axis tick labels as dollar amounts with comma separators.
# Lambda receives the tick value (x) and position (_)
ax.yaxis.set_major_formatter(mticker.FuncFormatter(lambda x, _: f'${x:,.0f}'))

# Rotate x-axis channel labels 45 degrees so they don't overlap.
ax.tick_params(axis='x', rotation=45)

# Add a dollar value label directly above each bar.
for bar, val in zip(bars, channel_ltv.values):
    ax.text(bar.get_x() + bar.get_width() / 2, bar.get_height() + 5,
            f'${val:,.0f}', ha='center', va='bottom', fontsize=9)

# Automatically adjust spacing.
plt.tight_layout()

plt.show()Code language: PHP (php)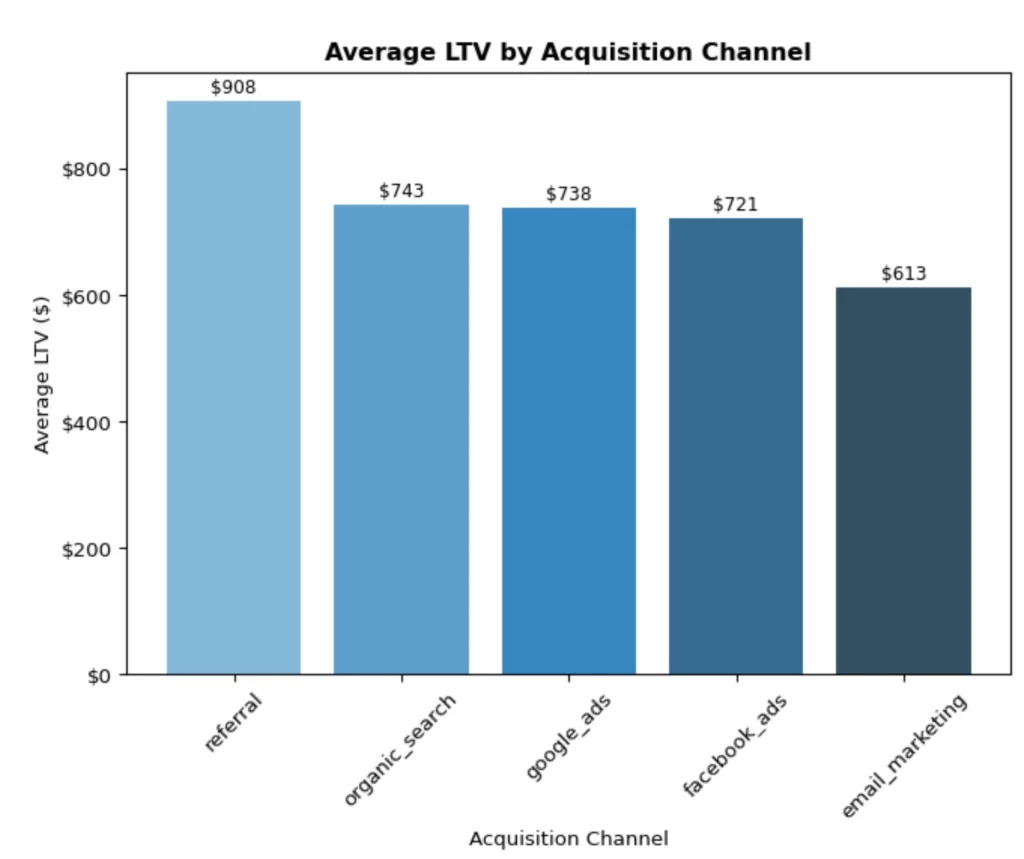
This makes it easier to see the value of each channel. In our data, customers from referral traffic are the most valuable. The action to take here could be to look at the referral sources, conversion rate of each, and how to grow the traffic from the source(s) with high LTV.
And that is basically it for historical LTV. It is fairly straight forward and a good place to begin in understanding LTV.
Predictive LTV
Now we move on to predictive LTV. This takes our historical data and uses it to predict future LTV. We’ll start by creating another function.
# Predictive LTV model
def build_ltv_prediction_model(ltv_data):
    # Prepare features - use utility class LabelEncoder
    # from sklearn.preprocessing to be able to convert
    # categorical labels to integers.
    le_channel = LabelEncoder()
    le_segment = LabelEncoder()

    # Use the data created in the historical LTV calculation (passed into function)
    # and transform acquisition_channel & customer_segment into integers.
    model_data = ltv_data.copy()
    model_data['channel_encoded'] = le_channel.fit_transform(model_data['acquisition_channel'])
    model_data['segment_encoded'] = le_segment.fit_transform(model_data['customer_segment'])

    # Features for prediction - we're going to use
    # these to help calculate future LTV.
    features = ['total_orders', 'avg_order_value', 'customer_lifespan_days',
               'purchase_frequency', 'channel_encoded', 'segment_encoded']

    X = model_data[features]
    y = model_data['historical_ltv']

    # Split data into 4 arrays, reserve 30% for testing,
    # 70% fo training, and seed (the 42) so the split is reproducible -
    # meaning the results will be the same each time this is run.
    X_train, X_test, y_train, y_test = train_test_split(X, y, test_size=0.3, random_state=42)

    # Train Random Forest model - this will
    # define the model and train it on the data.
    rf_model = RandomForestRegressor(n_estimators=100, random_state=42)
    rf_model.fit(X_train, y_train)

    # Predictions - runs the model and returns the predictions
    # to the variable (y_pred).
    y_pred = rf_model.predict(X_test)

    # Model performance - how well it matches reality.
    mse = mean_squared_error(y_test, y_pred)
    r2 = r2_score(y_test, y_pred)

    # Print out the results.
    print(f"Model Performance:")
    print(f"MSE: {mse:.2f}")
    print(f"R² Score: {r2:.3f}")
    print(f"RMSE: {np.sqrt(mse):.2f}")

    # Feature importance - how much each feature
    # contributed to the prediction.
    feature_importance = pd.DataFrame({
        'feature': features,
        'importance': rf_model.feature_importances_
    }).sort_values('importance', ascending=False)

    print("\nFeature Importance:")
    print(feature_importance)

    return rf_model, le_channel, le_segment

# Call function, use historical_ltv for the data.
ltv_model, channel_encoder, segment_encoder = build_ltv_prediction_model(historical_ltv)Code language: PHP (php)
Running this function will create an output that will tell you how accurate the model is and which features (‘total_orders’, ‘avg_order_value’, ‘customer_lifespan_days’, ‘purchase_frequency’, ‘channel_encoded’, ‘segment_encoded’) are most important in determining LTV.
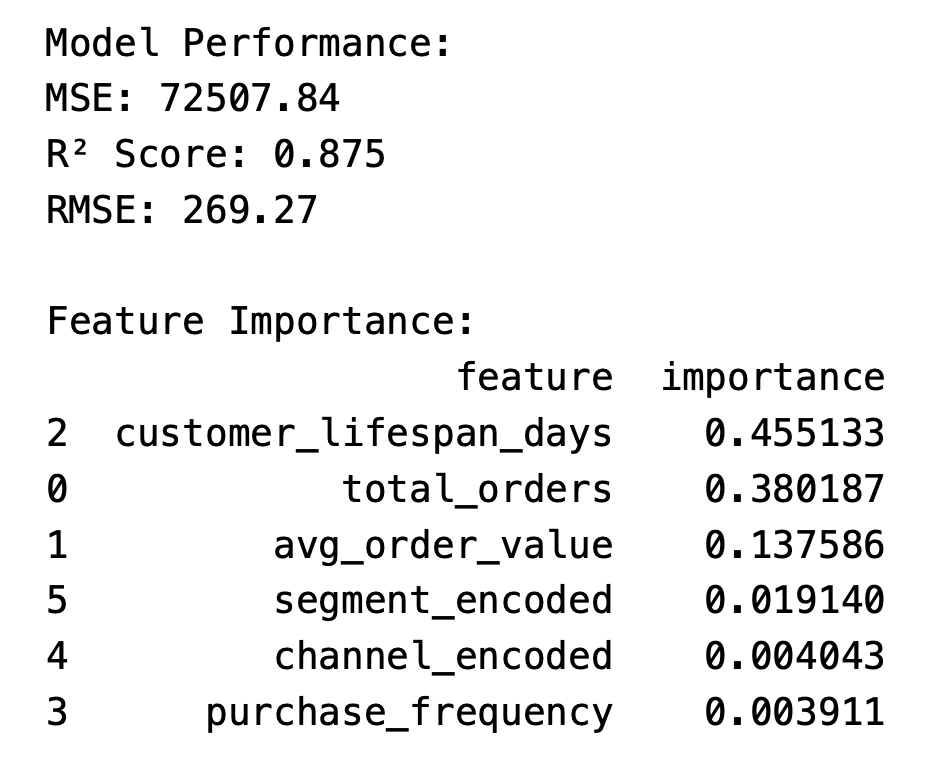
R2 will tell us how much of the variability of LTV is explained by the model. It ranges from -1.0 to 1.0. In this case, we have an R2 of 0.875, meaning that 87.5% of the variability is explained by the model. That leaves 12.5% unexplained, which can be due to noise, missing features, or just the limitations of the model.
The other output to look closely at is the feature importance. This will show, statistically, what attributes are important to LTV. As you can see, the customer lifespan in days is very important, while the purchase frequency is less so. The total orders each customer made and the order value are also important, in this case.
That’s the basics for calculating predictive LTV. The final approach to LTV is cohort-based.
Cohort-based LTV
Cohort-based LTV takes historical data, calculates purchase value by time period (usually month), groups those customers as cohorts, and tracks them over time to understand how much revenue each group generates over time, from the first purchase.
To do this, we are going to create another Python function, then pass the customers & orders dataframes into the function.
# Cohort-based LTV analysis
def cohort_ltv_analysis(customers_df, orders_df):

    # Create customer-order data - join customers & orders.
    customer_orders = customers_df.merge(orders_df, on='customer_id')

    # Convert order_date & first_purchase_date to datetime - dates can be funky.
    customer_orders['order_date'] = pd.to_datetime(customer_orders['order_date'])
    customer_orders['first_purchase_date'] = pd.to_datetime(customer_orders['first_purchase_date'])

    # Define cohorts by first purchase month.
    customer_orders['cohort_month'] = customer_orders['first_purchase_date'].dt.to_period('M')
    customer_orders['order_month'] = customer_orders['order_date'].dt.to_period('M')

    # Calculate period number (months since first purchase).
    customer_orders['period_number'] = (
        customer_orders['order_month'] - customer_orders['cohort_month']
    ).apply(attrgetter('n'))

    # Cohort analysis - group by month & period #.
    cohort_data = customer_orders.groupby(['cohort_month', 'period_number'])['order_value'].sum().reset_index()
    cohort_sizes = customers_df.groupby(
        pd.to_datetime(customers_df['first_purchase_date']).dt.to_period('M')
    ).size().reset_index()
    cohort_sizes.columns = ['cohort_month', 'cohort_size']

    # Join cohort_sizes & cohort_data. Calc revenue per customer.
    cohort_data = cohort_data.merge(cohort_sizes, on='cohort_month')
    cohort_data['revenue_per_customer'] = cohort_data['order_value'] / cohort_data['cohort_size']

    # Pivot for easier analysis.
    cohort_table = cohort_data.pivot_table(
        index='cohort_month',
        columns='period_number',
        values='revenue_per_customer'
    ).fillna(0)

    return cohort_table

cohort_ltv = cohort_ltv_analysis(customers, orders)Code language: PHP (php)
For this output, I’m going to use a heatmap. This will allow us to easily see which cohorts are more valuable than others and to see which periods are better than others.
fig, ax2 = plt.subplots(figsize=(10, 6))

cohort_display = cohort_ltv.iloc[:, :12]  # First 12 periods
sns.heatmap(
    cohort_display,
    ax=ax3,
    cmap='YlOrRd',
    fmt='.0f',
    annot=True,
    linewidths=0.5,
    cbar_kws={'label': 'Revenue per Customer ($)'}
)
ax2.set_title('Cohort LTV Heatmap (Revenue per Customer)', fontweight='bold')
ax2.set_xlabel('Months Since First Purchase')
ax2.set_ylabel('Cohort Month')

plt.tight_layout()
plt.show()Code language: PHP (php)
Although this data is not real, you can see that for some months, repeat sales dropped off quickly, while others lasted through our full 12 months. Each organization’s data will look very different.
Obviously, the later months will have less total time periods than the earlier months. Also, longer sales cycles might need longer cohort periods – quarters or years.
Summary
The basic calculation of LTV is fairly straight-forward – Revenue/Customers. However, there is so much more to understanding the true value of your customers. We have looked at this in a few different ways – using a prediction model, calculation cohort values, and slicing into some features such as channel.
I hope that this will help you see LTV as both a valuable concept and KPI for your organization. My next article will dive deeper into customer cohorts.
At Fujo, we help you align data, strategy and growth. If something in your business feels off but is difficult to pinpoint, it is often not in the most obvious places.
If you’re seeing margin pressure but can’t clearly identify where it’s coming from, that’s often where we start.
We work with brands to identify where performance is being lost across the system and uncover opportunities that do not show up in standard reporting.
If you are interested, we are always open to a conversation.