This article is also available on Medium.
Contribution margin is the 5th in a series of 11 articles on performance marketing concepts and how to calculate them. This is not an exhaustive list of performance marketing concepts, but some of the key ones that can help you understand your marketing efforts and how they are performing. The list of concepts are listed below.
- CPA (Cost Per Acquisition) – Channel efficiency analysis – one of the most important performance marketing metrics, representing the total cost to acquire one customer or conversion action.
- ROAS (Return on Ad Spend) – Campaign profitability measurement – a revenue efficiency metric that measures how much revenue is generated for every dollar spent on advertising.
- LTV (Customer Lifetime Value) – Predictive customer valuation – measures the total net profit a customer generates over their entire relationship with your business. It’s the foundation for determining how much you can afford to spend acquiring customers.
- Cohort Analysis – Customer behavior tracking over time – a method of grouping customers by shared characteristics (typically acquisition date) and tracking their behavior over time to understand patterns in retention, revenue, and lifetime value.
- Contribution Margin – True profitability assessment – the profit remaining after subtracting variable costs from revenue. It represents the amount available to cover fixed costs and generate profit, and critically for performance marketing, it determines how much you can afford to spend on customer acquisition.
- Customer Segmentation – RFM and behavioral clustering – the practice of dividing your customer base into distinct groups that share similar characteristics, behaviors, or value profiles—enabling targeted strategies that improve acquisition efficiency, retention, and lifetime value.
- Churn Prediction – Machine learning models for retention – uses historical customer behavior data to identify which customers are most likely to stop doing business with you, enabling proactive retention interventions before they leave.
- Personalized Offer Scoring – Targeted campaign optimization – predicts which specific offer (discount level, product, message, timing, channel) to present to each individual customer to maximize business outcomes while minimizing unnecessary cost—essentially applying incrementality principles at the individual customer level.
- Attribution Modeling – Multi-touch attribution including Markov chains – assigns credit for conversions across the multiple marketing touchpoints a customer encounters along their journey to purchase. It attempts to answer: “Which marketing activities actually drove this conversion?”
- Cohort-Based LTV – Advanced lifetime value forecasting – measures the actual lifetime value of customers grouped by a shared characteristic (typically acquisition date or channel), tracking their real revenue and behavior over time rather than relying on aggregate or modeled estimates.
- Order Economics – Transaction-level profitability analysis – the complete financial breakdown of an individual transaction—all revenue, costs, and resulting profit from a single order.
Understanding Contribution Margin
Contribution margin is a profitability framework that measures how much revenue from a customer or channel remains after subtracting the variable costs directly attributable to acquiring and serving that customer — before fixed costs are applied.
It is a calculation to determine if a given marketing activity generates enough return to cover its own costs and contribute to overhead and profit. This metric helps identify which customers, products, or campaigns generate the most profit after covering direct costs.
The basic calculation per order is the order value minus the COGS, fulfillment costs, payment processing costs, returns (if returned), and channel acquisition cost (marketing cost).
Contribution Margin = Order Value − COGS − Fulfillment − Payment Processing − Returns Reserve − Channel Acquisition Cost
If the contribution margin is zero or negative, then you are guaranteed to not make a profit because it is only covering the costs of the product, if that. If the contribution margin is greater than zero, then the more you sell, the more the sales will be able to cover fixed costs, as well as make a profit.
This becomes important as you analyze profit margin. The higher the contribution margin, the more potential you have to play with pricing for promotions, discounts, loyalty programs, etc. At a higher level, you’ll want to know what the contribution margin is as a percentage. This is so that you can compare products, marketing channels, etc.
The way to calculate contribution margin as a percentage is to take the above variable costs in aggregate. Then subtract them from revenue for those products and divide by the revenue.
Contribution Margin = (Revenue – Variable Costs) / Revenue
This has real world implications. For example, as you concentrate on ROAS, you may miss that the contribution margin from Facebook Ads is lower than Google Ads. This is true, even though the ROAS is higher. In other words, the variable costs on the sales from Facebook are higher than the variable costs on the sales from Google Ads.
Ultimately, this figures into LTV as well, since a low contribution margin can be good, if the LTV is high. Conversely, a high contribution margin can be not as good (I wouldn’t say bad, since a high contribution margin always has some positive value) if the LTV is low.
Calculating Contribution Margin
That’s all well and good, but how do we calculate contribution margin so we can analyze it? Well, you will need a couple key pieces of information such as those mentioned above: COGS, fulfillment costs, payment processing costs, channel costs. You don’t have to have all of these. However, you should have as many variable costs as you can get. This is so the analysis will be as accurate as possible.
Like the other articles in this series, I’m going to use Python to do the calculations. I’m going to use the same dataset that I have used throughout this series, so I’m going to skip retrieving the data and just start with the packages you’ll need.
# for creating dataframes
import pandas as pd
# plotting package for graphing
import matplotlib.pyplot as plt
# renders DataFrames as sortable, filterable HTML tables
from itables import showCode language: PHP (php)
Since we’ve already created the following dataframes: customers, marketing_spend, orders, and attribution_touchpoints, we’re going to now create a function. This is a function that we can call that will return a new dataframe named analysis_data. It will be a combination of customers & orders. Additionally, the function will add variable_costs, contribution_margin, contribution_margin_pct, gross_profit, & gross_margin_pct as columns in the analysis_data dataframe.
def contribution_margin_analysis(customers_df, orders_df):
    # use customer id to join customers to orders
    analysis_data = orders_df.merge(customers_df, on='customer_id')

    # we have product cost and shipping costs - both are variable costs -
    # so we'll add those together as variable_costs
    analysis_data['variable_costs'] = analysis_data['product_cost'] + analysis_data['shipping_cost']
    # we'll subtract the variable costs from the order value to get the dollar value
    # of the contribution margin
    analysis_data['contribution_margin'] = analysis_data['order_value'] - analysis_data['variable_costs']
    # to compare apples to apples, we want to calculate the contribution margin pct
    analysis_data['contribution_margin_pct'] = analysis_data['contribution_margin'] / analysis_data['order_value']
    # gross profit excludes shipping to isolate product economics from fulfilment costs
    analysis_data['gross_profit'] = analysis_data['order_value'] - analysis_data['product_cost']
    # gross margin benchmarks product pricing efficiency independent of fulfillment
    analysis_data['gross_margin_pct'] = analysis_data['gross_profit'] / analysis_data['order_value']

    # And return the dataframe analysis_data
    return analysis_dataCode language: PHP (php)
Contribution Margin by Orders
Now we’ll call the function and view the summary stats. This is a great way to look at the data without going through the whole dataframe.
# call the above function and assign it to contribution_data
contribution_data = contribution_margin_analysis(customers, orders)

# use show combined with describe, as well as round, to view the summary of the data
show(contribution_data[['order_value', 'variable_costs', 'contribution_margin', 'contribution_margin_pct']].describe().round(2))Code language: PHP (php)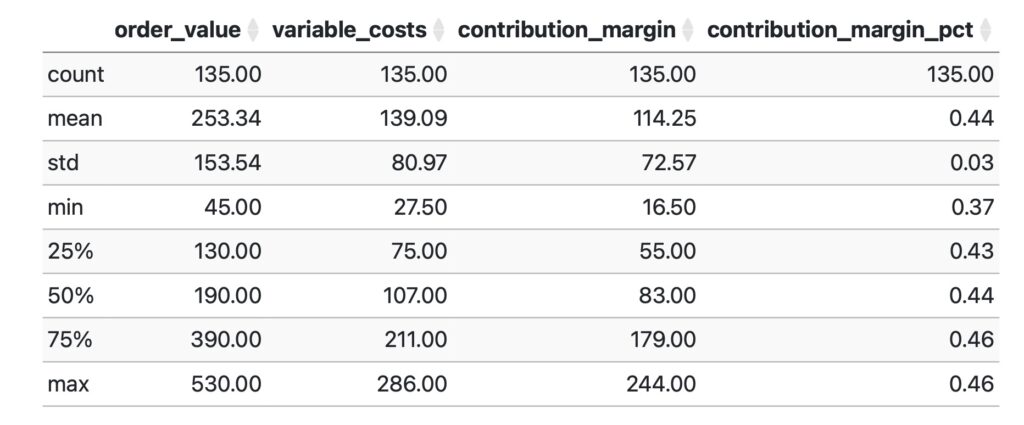
From this table, we can see that there are 135 orders with a mean value of $253.34, mean variable cost of $139.09 and an average contribution margin of $114.25 or 44%. With this data it’s interesting to look at the contribution margin percent. It ranges from 37% to 46% with a 3% standard deviation. This means that in this dataset, there is very little difference in contribution margin between orders.
Contribution Margin by Marketing Channel
We can look at this another way – aggregated by marketing channel. This way we can see which channels provide greater margin than others. With our current data, it will not vary much, but you get the idea.
# start with a multi-level column indexed aggregation function
channel_contribution = contribution_data.groupby('acquisition_channel').agg({
    'order_id': 'count',
    'order_value':['sum', 'mean'],
    'variable_costs': ['sum','mean'],
    'contribution_margin': ['sum', 'mean'],
    'contribution_margin_pct': 'mean'
}).round(2)

# then flatten into an ordinary dataframe
channel_contribution.columns = [
    'total_orders', 'total_revenue', 'avg_order_value',
    'total_variable_costs', 'avg_variable_cost', 'total_contribution', 'avg_contribution',
    'avg_contribution_pct'
]

# Pick out the columns we want to view
channel_summary = channel_contribution[['avg_order_value', 'avg_variable_cost', 'avg_contribution', 'avg_contribution_pct']]

# finally, display in a table
# display the channel-level breakdown as an interactive table
show(channel_summary.round(2))Code language: PHP (php)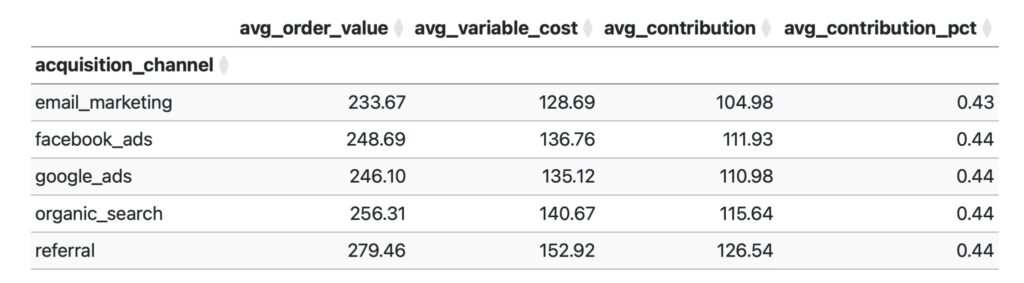
This is a fictitious dataset, so it’s also good to practice looking at the numbers, thinking about how realistic they are. In this case, the variable costs of email marketing and organic search is similar to Facebook & Google ads and there is very little variation across the board. In real life this would not be likely. However, it’s good to be suspicious and not just rely on what you see – if it doesn’t look right, investigate.
Customer Segment Profitability
In the dataset, we have calculated customer segments (customer_segment) as either high, medium, or low value. Now we can use contribution margin to calculate the marginal value of each segment. First, we’ll group by the segment column:
segment_profitability = contribution_data.groupby('customer_segment').agg({
    'contribution_margin': ['sum', 'mean', 'count'],
    'contribution_margin_pct': 'mean',
    'order_value': 'mean'
}).round(2)Code language: JavaScript (javascript)
Next, we’ll flatten out the results into the total contribution for each segment, the average contribution, the number of orders, the contribution percentage, and the average order value:
segment_profitability.columns = [
    'total_contribution', 'avg_contribution', 'order_count',
    'avg_contribution_pct', 'avg_order_value'
]Code language: JavaScript (javascript)
Finally, we’ll create a table to show the results:
show(segment_profitability)
Visualizations
We can more easily view these numbers as graphs – particularly the average contribution margin percent by channel and average contribution margin by segment. We’ll create a stacked grid to show two charts.
# Create grid
fig, ((ax1, ax2)) = plt.subplots(2, 1, figsize=(15, 12))


# the average contribution margin percent by channel graph
channel_contribution['avg_contribution_pct'].plot(kind='bar', ax=ax1, color='skyblue')
ax1.set_title('Average Contribution Margin % by Channel')
ax1.set_ylabel('Contribution Margin %')
# rotate labels to prevent overlap on longer channel names
ax1.tick_params(axis='x', rotation=45)

# the average contribution margin by segment graph
segment_profitability['avg_contribution'].plot(kind='bar', ax=ax2, color='lightgreen')
ax2.set_title('Average Contribution Margin by Segment')
ax2.set_ylabel('Contribution Margin ($)')
ax2.tick_params(axis='x', rotation=45)Code language: PHP (php)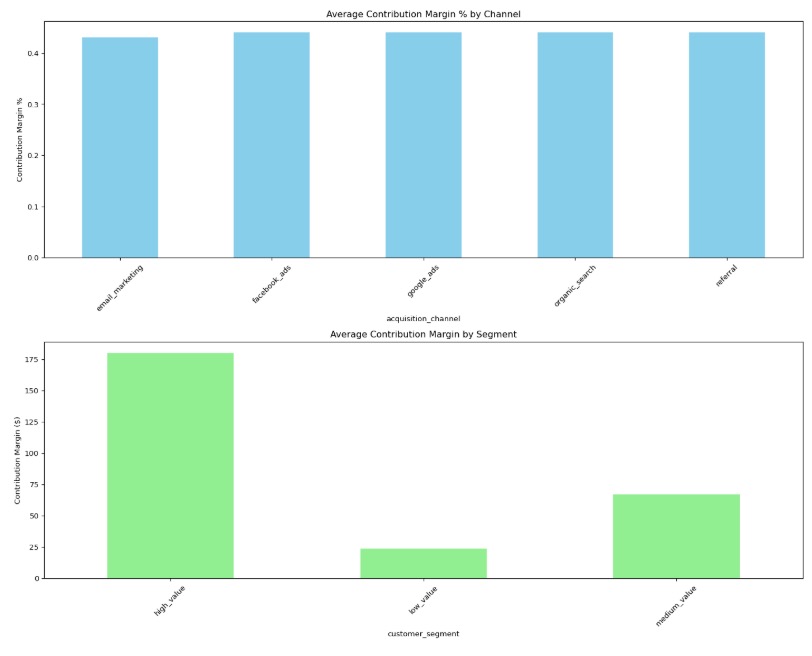
Conclusion
There is so much more you can do with contribution margin – like unit economics analysis and profitability modeling. I hope this has given you a start in thinking about this important business concept and how you can incorporate it into your performance marketing practice.
The next blog article will be on customer segmentation – similar to cohorts, but with some very distinct and important differences. Stay tuned!
At Fujo, we help you align data, strategy and growth. If you are having trouble with measuring and understanding the impact of your marketing, we can help!
When data is disconnected, strategy drifts. When strategy drifts, growth stalls. We align the three — so every decision, channel, and investment works together.
We work with brands to identify where performance is being lost across the system and uncover opportunities that do not show up in standard reporting.
If you are interested, we are always open to a conversation.