This article is also available on Medium.
Customer segmentation is the 6th in a series of 11 articles on performance marketing concepts and how to calculate them. This is not an exhaustive list of performance marketing concepts, but some of the key ones that can help you understand your marketing efforts and how they are performing. The list of concepts are listed below.
- CPA (Cost Per Acquisition) – Channel efficiency analysis – one of the most important performance marketing metrics, representing the total cost to acquire one customer or conversion action.
- ROAS (Return on Ad Spend) – Campaign profitability measurement – a revenue efficiency metric that measures how much revenue is generated for every dollar spent on advertising.
- LTV (Customer Lifetime Value) – Predictive customer valuation – measures the total net profit a customer generates over their entire relationship with your business. It’s the foundation for determining how much you can afford to spend acquiring customers.
- Cohort Analysis – Customer behavior tracking over time – a method of grouping customers by shared characteristics (typically acquisition date) and tracking their behavior over time to understand patterns in retention, revenue, and lifetime value.
- Contribution Margin – True profitability assessment – the profit remaining after subtracting variable costs from revenue. It represents the amount available to cover fixed costs and generate profit, and critically for performance marketing, it determines how much you can afford to spend on customer acquisition.
- Customer Segmentation – RFM and behavioral clustering – the practice of dividing your customer base into distinct groups that share similar characteristics, behaviors, or value profiles—enabling targeted strategies that improve acquisition efficiency, retention, and lifetime value.
- Churn Prediction – Machine learning models for retention – uses historical customer behavior data to identify which customers are most likely to stop doing business with you, enabling proactive retention interventions before they leave.
- Personalized Offer Scoring – Targeted campaign optimization – predicts which specific offer (discount level, product, message, timing, channel) to present to each individual customer to maximize business outcomes while minimizing unnecessary cost—essentially applying incrementality principles at the individual customer level.
- Attribution Modeling – Multi-touch attribution including Markov chains – assigns credit for conversions across the multiple marketing touchpoints a customer encounters along their journey to purchase. It attempts to answer: “Which marketing activities actually drove this conversion?”
- Cohort-Based LTV – Advanced lifetime value forecasting – measures the actual lifetime value of customers grouped by a shared characteristic (typically acquisition date or channel), tracking their real revenue and behavior over time rather than relying on aggregate or modeled estimates.
- Order Economics – Transaction-level profitability analysis – the complete financial breakdown of an individual transaction—all revenue, costs, and resulting profit from a single order.
Understanding Customer Segmentation
Customer segmentation is the process of dividing your customer base into distinct groups based on behavior, value, or their characteristics (like age or location). This enables you to target your marketing and better personalization – making the messaging and experiences more relevant to the customer.
There are a number of relevant ways to segment your customer, here are four:
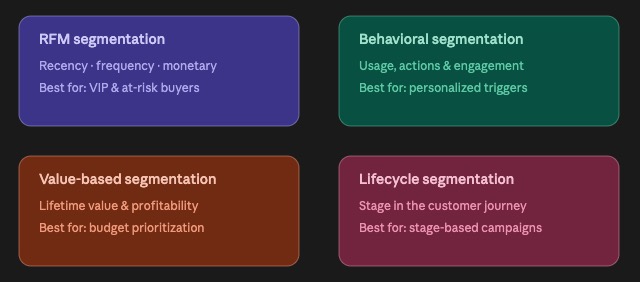
Some of these can be combined to create additional segments, depending on the marketing and the type of outreach. Any segmentation should also be tested to ensure you are targeting the right segments.
RFM Segmentation
If you have ever worked on CRM, you’ll be familiar with this type of segmentation. Recency is how long it’s been since they have purchased, for example. Frequency is how often they purchase. Monetary value is the amount of money they have spent with you.
This type of segmentation does not require statistical modeling and is fairly easy to calculate. You can score customers on each of these three metrics to find your most valuable customers as well as who might be slipping away, giving you a chance to stop the slide. That’s basically one of the goals of CRM.
Behavioral Segmentation
Behavioral segmentation looks at what customers do, not just what they buy – how often they visit the website, what they browse, how they get to the website (channel), email interaction, etc.
This needs event-level or clickstream data and is usually built with some kind of clustering (like k-means) models. It’s the segmentation type most directly actionable for triggered messaging and personalization logic.
Value-Based Segmentation
Value-based segmentation takes the idea of RFM and extends it into the future – it uses predicted customer lifetime value and margin/profitability to rank customers, rather than past recency/frequency/spend. This is where segmentation intersects most directly with CLV modeling.
It requires assumptions about retention curves, discount rates, and contribution margin, so the segmentation quality is only as good as the CLV model underneath it. It’s the natural input for budget allocation decisions – who’s worth acquiring, who’s worth retaining.
Lifecycle Segmentation
Lifecycle segmentation is stage-based. Where in the lifecycle is the customer currently – are they new or a prospect, currently active, at-risk of losing, or have lapsed.
It’s not so much about ranking, it’s more about sequencing. Each stage implies a different messaging objective. In practice this is often the organizing layer, with RFM or value tiers nested inside each lifecycle stage (e.g. “at-risk, high-value” gets different treatment than “at-risk, low-value”).
Calculating Customer Segmentation
Understanding how to calculate customer segments will help you use them in the real world. Using the same dataset I’ve used throughout this series, I’m going to create an analysis and scoring for RFM and a K-means clustering for behavioral segmentation.
For RFM Analysis, I’m going to create a function named rfm_analysis(). This calculates recency/frequency/monetary metrics. The output will be an analysis table. We’ll use the recency, frequency, and monetary value scores to create named segments and output their distribution in another table.
For Behavioral Segmentation, we’ll create a function named behavioral_segmentation(). This will build K-means clusters customers on top of the RFM features. Its output (clusters) will be computed and summarized in a table after using the elbow method to determine the optimal number of clusters.
Loading Required Modules
We’ll need a few modules to get started. These are for modeling and plotting the graphs.
from sklearn.cluster import KMeans
from sklearn.preprocessing import StandardScaler
import matplotlib.pyplot as pltCode language: JavaScript (javascript)
RFM Analysis
We’re going to start by declaring the function and taking the data from the previously loaded dataframes and assigning them to new variables, as well as setting the analysis end date.
def rfm_analysis(customers_df, orders_df, analysis_date='2023-12-31'):
    analysis_date = pd.to_datetime(analysis_date)

    # Merge customer and order data
    customer_orders = customers_df.merge(orders_df, on='customer_id')
    customer_orders['order_date'] = pd.to_datetime(customer_orders['order_date'])Code language: PHP (php)
Next, we are going to calculate the RFM metrics.
    rfm = customer_orders.groupby('customer_id').agg({
        'order_date': lambda x: (analysis_date - x.max()).days,  # Recency
        'order_id': 'count',  # Frequency
        'order_value': ['sum', 'mean']  # Monetary
    }).round(2)Code language: PHP (php)
We’re going to flatten out the column names, add customer information, close the function, then call it and print the results.
# Flatten column names
    rfm.columns = ['recency', 'frequency', 'monetary_total', 'monetary_avg']
    rfm.reset_index(inplace=True)

    # Add customer information
    rfm = rfm.merge(customers_df[['customer_id', 'acquisition_channel', 'customer_segment']],
                    on='customer_id')

    return rfm

rfm_data = rfm_analysis(customers, orders)
print("RFM Analysis Results:")
print(rfm_data.describe())Code language: PHP (php)
From this we get a table that describes the RFM data:
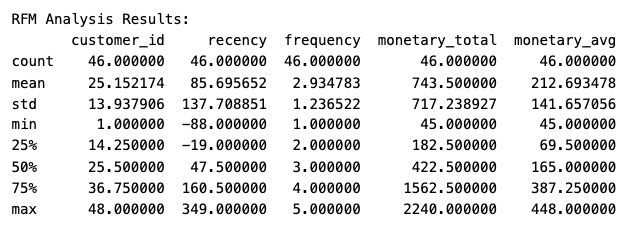
We can then fold in the RFM scores and create named segments based on scoring. We’ll create a new function named calculate_rfm_scores() and pass in the rfm_data.
# Calculate RFM scores
def calculate_rfm_scores(rfm_df):
    # Calculate quintiles for each metric
    rfm_df['recency_score'] = pd.qcut(rfm_df['recency'], 5, labels=[5,4,3,2,1])  # Lower recency is better
    rfm_df['frequency_score'] = pd.qcut(rfm_df['frequency'].rank(method='first'), 5, labels=[1,2,3,4,5])
    rfm_df['monetary_score'] = pd.qcut(rfm_df['monetary_total'], 5, labels=[1,2,3,4,5])

    # Create RFM segments
    rfm_df['rfm_score'] = (rfm_df['recency_score'].astype(str) +
                          rfm_df['frequency_score'].astype(str) +
                          rfm_df['monetary_score'].astype(str))Code language: PHP (php)
That code created the RFM segments. The next bit of code defines the segment names.
    # Define segment names based on RFM scores
    def segment_customers(row):
        if row['recency_score'] >= 4 and row['frequency_score'] >= 4 and row['monetary_score'] >= 4:
            return 'Champions'
        elif row['recency_score'] >= 3 and row['frequency_score'] >= 3 and row['monetary_score'] >= 3:
            return 'Loyal Customers'
        elif row['recency_score'] >= 3 and row['frequency_score'] <= 2 and row['monetary_score'] >= 3:
            return 'Big Spenders'
        elif row['recency_score'] >= 4 and row['frequency_score'] <= 2:
            return 'New Customers'
        elif row['recency_score'] <= 2 and row['frequency_score'] >= 3:
            return 'At Risk'
        elif row['recency_score'] <= 2 and row['frequency_score'] <= 2 and row['monetary_score'] >= 3:
            return 'Cannot Lose Them'
        elif row['recency_score'] <= 2 and row['frequency_score'] <= 2 and row['monetary_score'] <= 2:
            return 'Hibernating'
        else:
            return 'Others'Code language: PHP (php)
Now we have the following segments defined:
- Champions
- Loyal Customers
- Big Spenders
- New Customers
- At Risk
- Cannot Lose Them
- Hibernating
- Others
We always want to have an ‘Others’ segment, just in case there is something unexpected that doesn’t fit into the segment definitions we have created. You can call your segments whatever makes sense to you – it doesn’t have to be these segment names. You can also define each segment the way that makes sense to you.
We are going to close the function, call it, and print the scorecard.
    rfm_df['rfm_segment'] = rfm_df.apply(segment_customers, axis=1)
    return rfm_df

rfm_scored = calculate_rfm_scores(rfm_data.copy())
print("\nRFM Segmentation Distribution:")
print(rfm_scored['rfm_segment'].value_counts())Code language: PHP (php)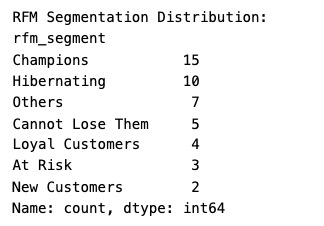
That gives us our RFM segmentation. We’ll next use K-means clustering for behavioral segmentation and we’re going to use the RFM data to help calculate new segments.
Behavioral Segmentation
Since I’m using the same sample data throughout this series, there will be some limitations. For this example, I’m re-deriving clusters from RFM inputs. With richer transactional data (product categories, channels, session behavior) I would feed in behavioral features rather than re-deriving clusters from RFM inputs. However, this can give you a sense as to how behavioral segmentation can work.
We’re going to create a function named behavioral_segmentation, define some features from the RFM data, then limit the columns to just those features. We’ll start with a default cluster of 4.
def behavioral_segmentation(rfm_df, n_clusters=4):

    features = ['recency', 'frequency', 'monetary_total', 'monetary_avg']
    X = rfm_df[features]Code language: JavaScript (javascript)
Next, we’re going to rescale each feature so that large values (like monetary_total) don’t dominate calculations. Then we’ll fit the scaler to X and return the standardized feature array used for clustering.
    scaler = StandardScaler()
    X_scaled = scaler.fit_transform(X)
We’re going to use the elbow method (a way to determine the # of clusters, k, in k-means) by creating an empty set, inertias, then defining a range of candidate clusters to test.
  inertias = []
  K_range = range(1, 9)
Next we’ll loop through each of them.
    for k in K_range:
        # Creates a K-means model for the current k, with a fixed random_state for reproducibility
        # and n_init=10 (runs the algorithm 10 times with different centroid seeds, keeping the best).
        kmeans = KMeans(n_clusters=k, random_state=42, n_init=10)
        # Fits the model to the standardized data, assigning points to k clusters.
        kmeans.fit(X_scaled)
        # Records this model's inertia (sum of squared distances of points to their closest centroid)
        # for later plotting on the elbow curve.
        inertias.append(kmeans.inertia_)Code language: PHP (php)
And plot the results.
   # Opens a new matplotlib figure sized 10x6 inches to hold the elbow plot.
    plt.figure(figsize=(10, 6))
    # Plots inertia against number of clusters as blue circles connected by lines ('bo-'),
    # visually showing where adding more clusters stops reducing inertia much (the "elbow").
    plt.plot(K_range, inertias, 'bo-')
    # Labels the x-axis to indicate it represents the number of clusters tested.
    plt.xlabel('Number of clusters')
    # Labels the y-axis to indicate it represents inertia (within-cluster variance).
    plt.ylabel('Inertia')
    # Sets the chart title identifying this as the elbow method plot for choosing k.
    plt.title('Elbow Method for Optimal k')
    # Turns on the background grid to make it easier to read inertia values at each k.
    plt.grid(True)
    # Renders the elbow plot to output.
    plt.show()Code language: PHP (php)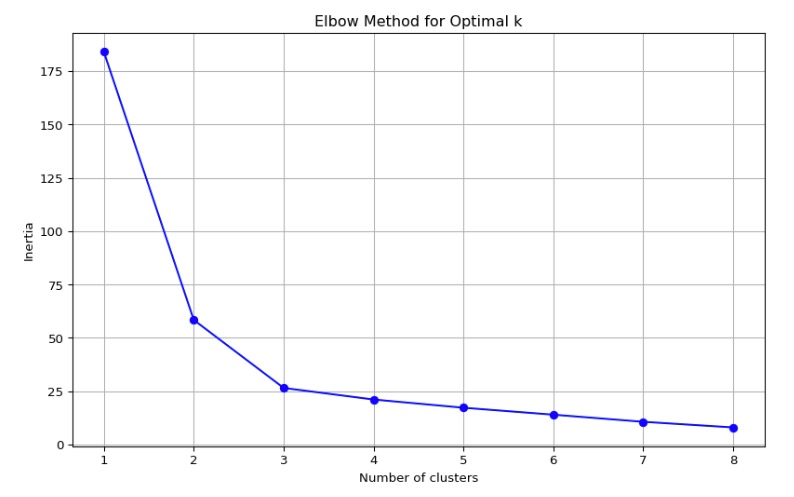
From the chart, inertia drops sharply through k=3, then flattens. So we’ll update our k to 3.
    kmeans = KMeans(n_clusters=3, random_state=42, n_init=10)
    clusters = kmeans.fit_predict(X_scaled)
Next, we’ll make a copy of the rfm_df dataframe, add the cluster, and group customers by their assigned clusters.
    # Add cluster labels to dataframe
    # Makes a copy of the input dataframe so the original rfm_df passed in by the caller isn't mutated.
    rfm_df = rfm_df.copy()
    # Attaches the cluster assignments as a new column aligned by row order.
    rfm_df['cluster'] = clusters

    # Analyze clusters
    # Groups customers by their assigned cluster and aggregates: counts customer_id (segment size),
    # averages recency and frequency, computes both mean and sum of monetary_total, and averages monetary_avg.
    cluster_summary = rfm_df.groupby('cluster').agg({
        'customer_id': 'count',
        'recency': 'mean',
        'frequency': 'mean',
        'monetary_total': ['mean', 'sum'],
        'monetary_avg': 'mean'
    }).round(2)Code language: PHP (php)
Let’s now flatten the multi-level columns and calculate percentages for each cluster’s share of total customer base and revenue. We’ll return the dataframe and close the function.
    cluster_summary.columns = ['customer_count', 'avg_recency', 'avg_frequency',
                              'avg_monetary', 'total_monetary', 'avg_order_value']

    # Computes each cluster's share of the total customer base as a percentage.
    cluster_summary['pct_customers'] = (cluster_summary['customer_count'] /
                                      cluster_summary['customer_count'].sum()) * 100
    # Computes each cluster's share of total revenue (summed monetary_total) as a percentage.
    cluster_summary['pct_revenue'] = (cluster_summary['total_monetary'] /
                                    cluster_summary['total_monetary'].sum()) * 100

    # Returns the customer-level dataframe (with cluster labels), the per-cluster summary table,
    # plus the fitted scaler and kmeans model so downstream functions can reuse the same transform/model.
    return rfm_df, cluster_summary, scaler, kmeansCode language: PHP (php)
Next we need to call the function and print the cluster summary.
clustered_data, cluster_summary, scaler, kmeans_model = behavioral_segmentation(rfm_scored)
print("\nCluster Analysis Summary:")
print(cluster_summary)Code language: PHP (php)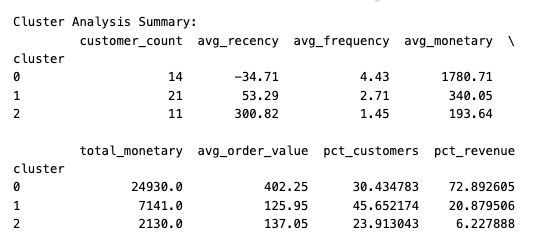
This shows that 30% of customers account for 73% of revenue and they have orders after the hard-coded date used in this example. Cluster 0 are the frequent, high-order-value, recently active customers, while the other two are mid-to-low value. This is a textbook Pareto pattern and is the kind of “who actually matters” read we are looking for in behavioral segmentation.
Conclusion
Customer segmentation is a powerful way to understand your customers and how to interact with them. Some customers are high value and you want to ensure they are satisfied and some you can identify as changing their RFM and can address changes before they leave. Different segments have different needs and should be addressed differently.
We worked through some Python code and demonstrated some ways of calculating segments. But this is just a small sample of how you can segment your customers. There is a lot more to it and there are plenty of tools out there beyond coding to help you.
The next blog article will be on churn prediction, which uses historical customer behavior data to identify which customers are most likely to stop doing business with you, enabling you to proactively intervene before they leave.
At Fujo, we help you align data, strategy and growth. If you are having trouble with measuring and understanding the impact of your marketing, we can help!
When data is disconnected, strategy drifts. When strategy drifts, growth stalls. We align the three — so every decision, channel, and investment works together.
We work with brands to identify where performance is being lost across the system and uncover opportunities that do not show up in standard reporting.
If you are interested, we are always open to a conversation.